Email Metrics API
Get deliverability and engagement metrics through the new Email Metrics API.
Today we are releasing the new Email Metrics API.
Get data about your emails, from the send volume to unsubscribe rate, grouped or filtered by the period, domain, broadcast, or email.
This data enables you to build:
- custom dashboards showing your deliverability and reputation metrics
- reports that summarize campaign performance
- alerts to notify you if bounce or complaint rates spike
Try hooking your agent up to the Resend MCP server and asking:
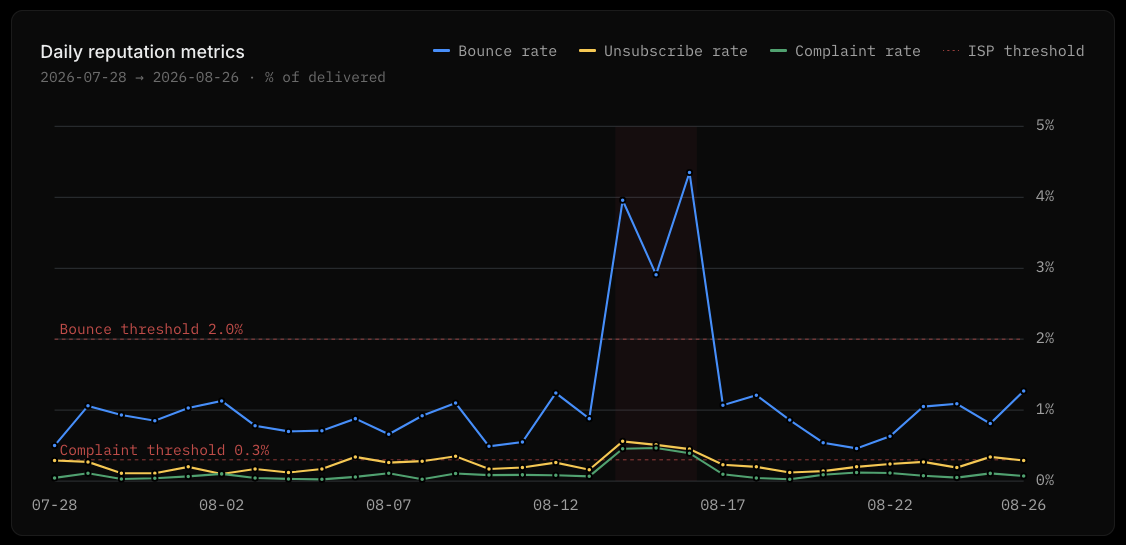
Chart our sender reputation risk over the last 30 days: bounce rate, unsubscribe rate, and complaint rate as percentages of delivered. Flag if any metric crossed the Gmail/Yahoo thresholds.
Your agent will build out a custom dashboard showing you those deliverability metrics plotted against industry thresholds.
How it works
A new API endpoint is available: /emails/metrics.
Making a request with no parameters returns all metrics for all of your emails over the past 7 days.
import { Resend } from 'resend';const resend = new Resend('re_xxxxxxxxx');const { data } = await resend.emails.metrics()
The response will look like this, with the totals for each metric over the period.
{"object": "metrics","start_date": "2026-08-20T06:30:00.000Z","end_date": "2026-08-26T06:30:00.000Z","metrics": ["received", "delivered", "complained", "suppressed", "bounced", "bounced_transient", "bounced_permanent", "bounced_undetermined", "opened", "clicked", "unsubscribed", "delivery_delayed", "failed", "sent", "unique_opened", "unique_clicked", "delivery_rate", "open_rate", "click_rate", "bounce_rate", "complaint_rate", "unsubscribe_rate"],"dimensions": [],"granularity": "daily","totals": {"received": 0,"delivered": 0,"complained": 0,"suppressed": 0,"bounced": 0,"bounced_transient": 0,"bounced_permanent": 0,"bounced_undetermined": 0,"opened": 0,"clicked": 0,"unsubscribed": 0,"delivery_delayed": 0,"failed": 0,"sent": 0,"unique_opened": 0,"unique_clicked": 0,"delivery_rate": 0,"open_rate": 0,"click_rate": 0,"bounce_rate": 0,"complaint_rate": 0,"unsubscribe_rate": 0}}
Filtering and grouping
There are three components to the metrics API:
- filters (
start_date,end_date,timezone): these help you restrict the time period over which the metrics are returned. Thestart_datecan go back as far as your account retains data. - metrics: these are the numbers you want to see. By default the API returns all the metrics available, but you can restrict the metrics returned. For example, to retrieve the open and click rate only, pass
metrics=opened,clicked. - dimensions: these are ways to group the metrics. For example, you can group by period, then set the granularity to "hourly" and you would see a group of metrics for each hour in the period.
Read more about the available parameters in the Email Metrics API documentation.
To list the sent and delivered metrics for each domain over the last day, broken down by hour like this, make a request like:
import { Resend } from 'resend';const resend = new Resend('re_xxxxxxxxx');const { data } = await resend.emails.metrics({startDate: '2026-08-25',endDate: '2026-08-26',granularity: 'hourly',metrics: ['sent', 'delivered'],dimensions: ['period', 'domain'],})
When you choose dimensions to partition the data, the data array shows each group. For instance, in the example response below the data is grouped by both domain and hour because the dimensions "period" and "domain" were selected and the granularity was set to "hourly".
{"object": "metrics","start_date": "2026-08-25T06:30:00.000Z","end_date": "2026-08-26T06:30:00.000Z","metrics": ["sent","delivered"],"dimensions": ["period","domain"],"granularity": "hourly","totals": {"sent": 10,"delivered": 10},"data": [{"period": "2026-08-25T06:00:00.000Z","domain_id": "2a3a2d12-cfbf-4179-b2bd-802975ead309","domain_name": "example.com","sent": 10,"delivered": 10}]}
These metrics APIs are part of a larger move to bring the full functionality of the dashboard into the API, CLI, and MCP, so you can build how you want or experience the data through your agent.